Nutrition study reveals instability in world’s most important fishing regions
12 February 2018

Ocean food resources are most volatile in areas which hold most of the world’s marine resources, like fish, a new study has revealed.
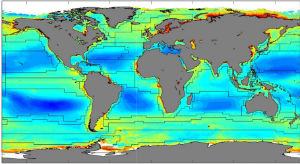
The University of Reading study provides the first ever estimate of the nutritional value of phytoplankton – organisms at the base of food chain that allows ocean ecosystems to thrive – across the world’s oceans throughout the year. These estimates can be made using only satellite images.
Published in The ISME Journal, the research shows that the most significant spatial and seasonal contrast in the nutritional value of phytoplankton is seen in coastal areas, represented by 22 coastal provinces, such as the North-East Atlantic Coastal Shelves and the South China Sea. Coastal areas collectively provide the majority of the world’s marine economic resources including commercial fish stocks.
Dr Shovonlal Roy, the environmental scientist who carried out the study, said: “Good quality food in sufficient quantities is essential for the sustainability of ecosystems, and phytoplankton provides the base of the ocean’s food chains. The dramatic spatial and seasonal variation we see in the nutritional value of phytoplankton in coastal areas may make them vulnerable to any future environmental changes, such as global warming.”
A feature of the new study is that the phytoplankton energy value was calculated using satellite images. Taken by the European Space Agency between 1997 and 2013, the images indicate where blooms of chlorophyll-containing phytoplankton are, as the colour of the ocean is altered by the light absorption.
Previous studies have shown that the size of phytoplankton cells determines how rich they are in carbohydrates, proteins and fatty acids. Dr Roy looked at cell sizes in hundreds of phytoplankton samples, collected by oceanographic cruises from regions across the world, which allowed an estimate to be made using the satellite images.
The study found that the nutritional value of phytoplankton strongly differed depending on its type, location and time of the year. It suggests that this value is at its highest in September and lowest in June.
Dr Roy’s estimations identify that the highest annually-averaged surface concentrations of nutrients are over the North-East Atlantic Coastal Shelves, whereas, the lowest concentrations were seen in the North Atlantic Tropical Gyral and in North Pacific Subtropical Gyre West.
Other factors that produce changes in ocean colour, such as cloud or ice cover, atmospheric particles or other organic matter could cause potential inaccuracies in the estimates. However, the method can be improved by collecting more phytoplankton samples to validate the estimates at local sites, and increasing the resolution of satellite images.
Dr Roy said: “It should now be a priority to obtain more measurements to allow us to test the accuracy of our predictions, as this will offer hugely important information on the sustainability of the world’s marine ecosystems.”
Images used to make the estimates were obtained from the European Space Agency’s Ocean Colour Climate Change Initiative (OC-CCI).
Full reference:
Roy, S (2018). ‘Distributions of phytoplankton carbohydrate, protein and lipid in the world oceans from satellite ocean colour’. The ISME Journal. Doi: 10.1038/s41396-018-0054-8
