Reading Festival 2019: Climate change research takes centre stage
27 August 2019
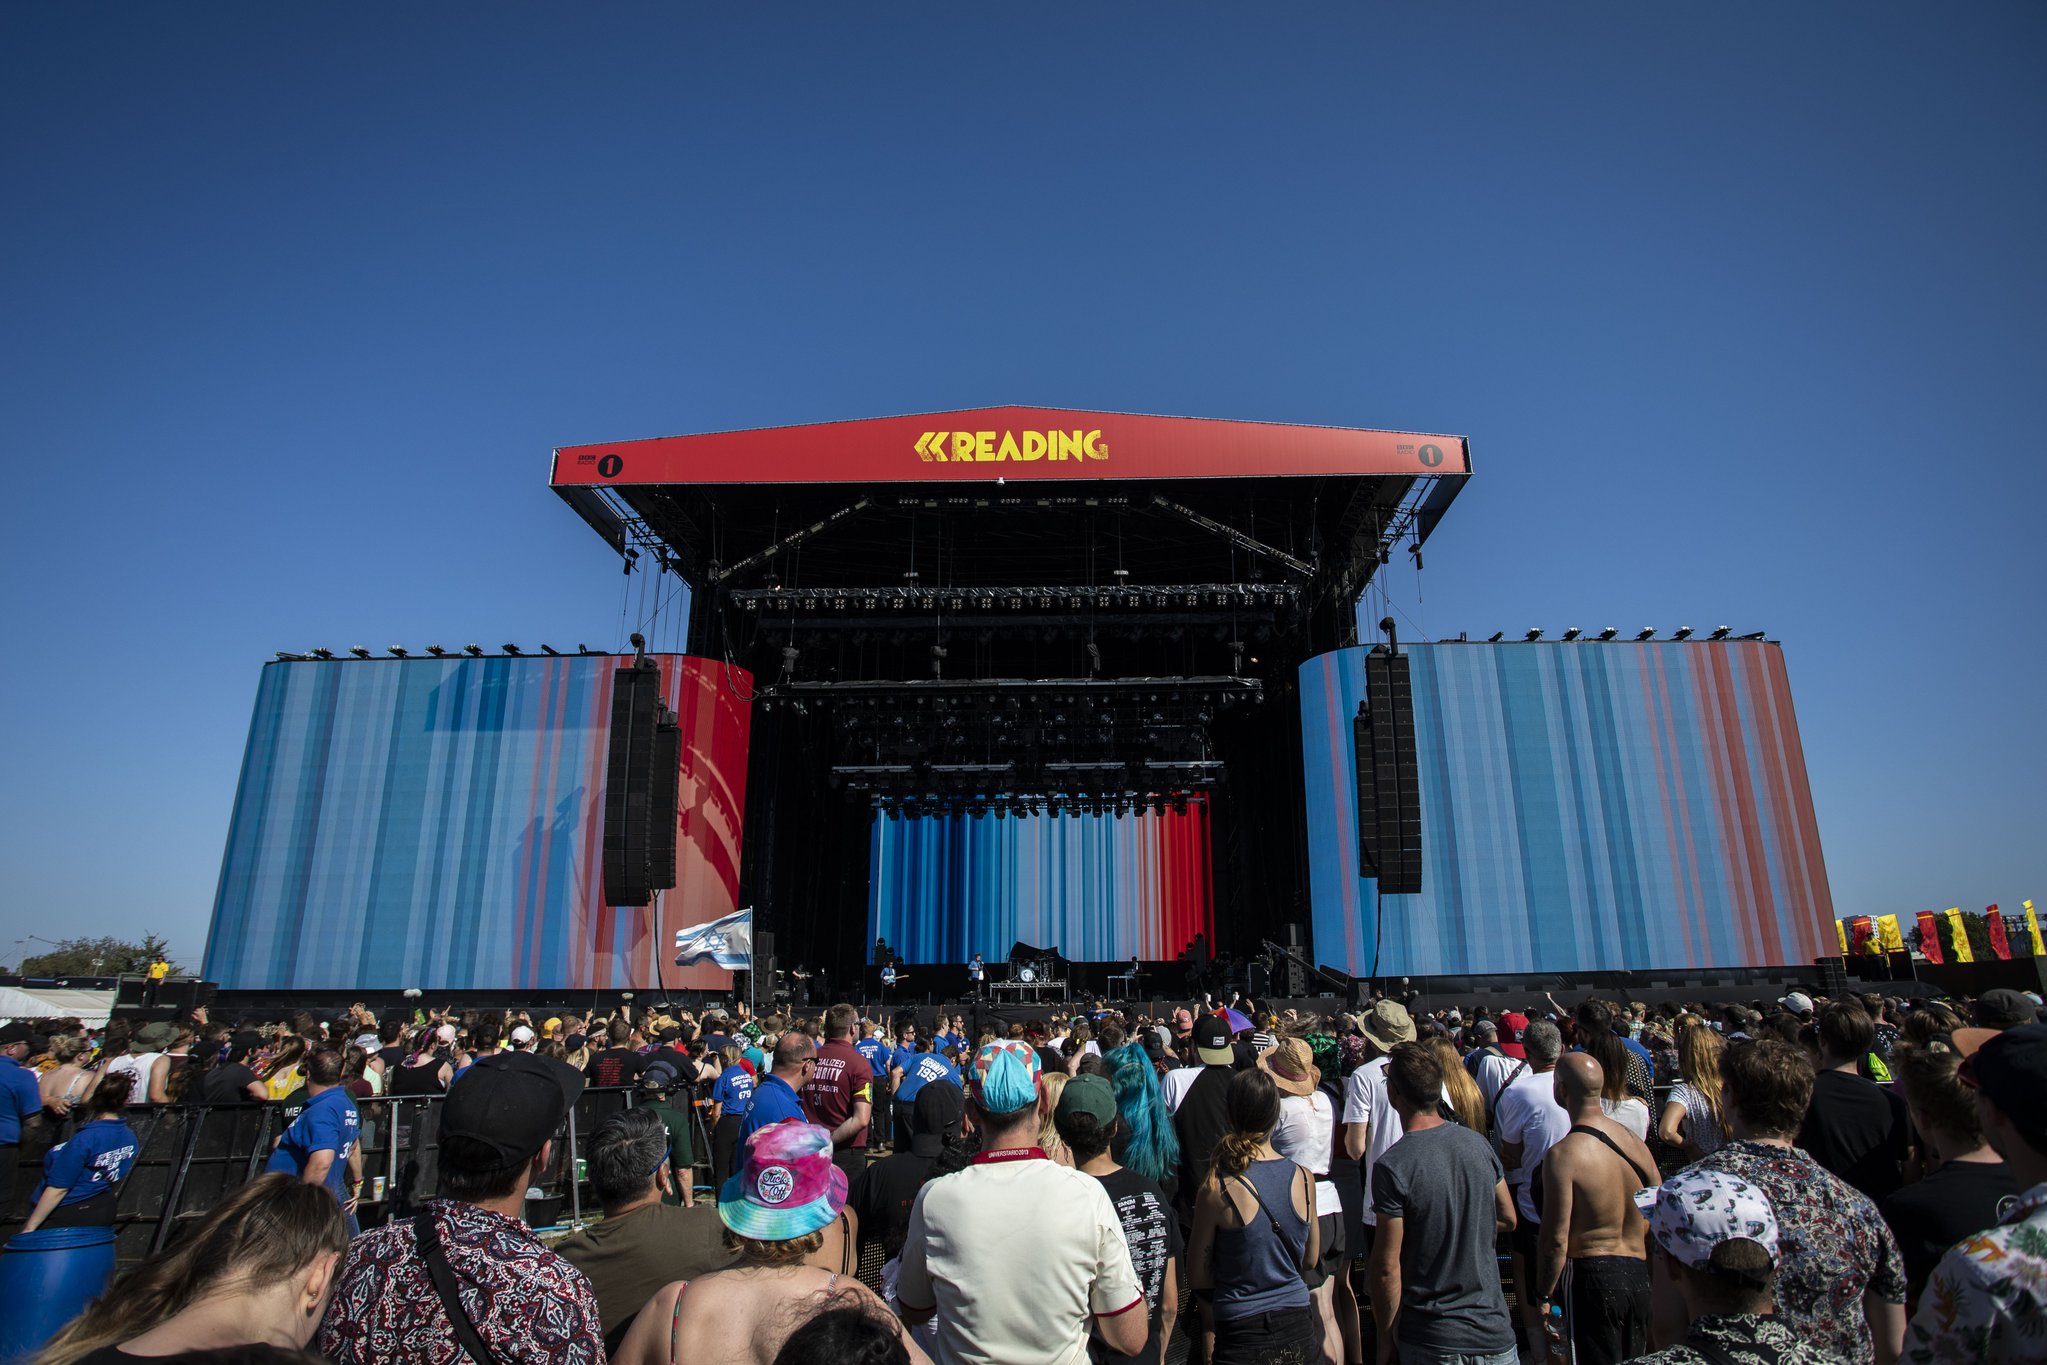
A climate change visualisation created at the University of Reading was seen by tens of thousands of music fans as rock band Enter Shikari used it as a backdrop during their Reading Festival set.
Professor Ed Hawkins’ climate stripes graphic was animated on the big screen behind the band (16 mins 50 secs) during their song ‘Juggernauts’. The image shows how average global temperatures have risen since 1850, with blue representing cooler years and red hotter years.
After the song, lead singer Rou Reynolds explained to the crowd what the graphic illustrated, calling it “one of the most crucial images of our times” and imploring their fans to “spread truth like this as far and wide as we can”..
He said: “We’ve been taking this piece of indisputable science throughout Europe, throughout the festivals we’ve been playing, and we’re so happy and so proud to bring it here to Reading, not only because it’s so important but because this image, this research, was done by climate scientists right here at Reading University.”
In an interview with Reading students carrying out internships at the festival, Rou said he had discovered the graphic on social media, which led him to Professor Hawkins’ Twitter account.
“It immediately resonated with me because it’s so bold and simple. I feel like for people who aren’t living within science graphs can be quite imposing, but this is like, you can see exactly what it says.
“Also, in an artistic, aesthetic sense it’s a beautiful image, even though it’s a horrifying thing. We immediately fell in love with it and were like, ‘OK, we need to employ this somehow in what we’re doing’.”
Members of the public can download climate stripes graphics for almost every country in the world by visiting showyourstripes.info