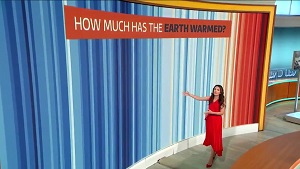
#LockdownClimateChange: Show your stripes to help the planet
18 June 2020

Weather presenters, scientists, and people concerned about climate change worldwide have answered the call to #ShowYourStripes today for the third year running.
The climate stripes graphics show how annual average temperatures have risen in every corner of the globe. People can download the latest updated data for their country from the showyourstripes.info website, and see how the latest figures up to 2019 have changed the picture of global warming.
Today, as part of the annual event close to the summer solstice, hundreds of weather presenters and broadcast meteorologists around the world have shown the stripes during weather forecasts and bulletins, including on BBC Weather and ITV’s Good Morning Britain in the UK.
The ‘climate stripes’ graphics were first made at the University of Reading by climate scientist Professor Ed Hawkins in 2018, and have since spread worldwide. This year, the annual global event follows the Reading #LockdownClimateChange campaign, highlighting how action on climate change requires a similar intensity of global change as brought about by the Covid-19 pandemic.
Professor Hawkins, climate scientist at National Centre for Atmospheric Science at the University of Reading, said: “We’re asking everyone to show their stripes for the climate. We hope that by raising awareness of this data in a visual and accessible way more people will wake up to the reality of climate change, wherever they live.
“I would urge anyone who cares the future of our planet to check out the stripes for their region and share it with others. It’s a powerful way to show what we humans have already done to the climate in our respective home countries.”
Professor Mark Fellowes, Pro-Vice Chancellor for Academic Planning and Resources at the University of Reading said:
“Show Your Stripes reminds us all that the threat of climate change hasn’t gone away. A warming planet is a threat to everyone’s health and livelihood, and those of generations to come.
“At the University of Reading, we are doing something about climate change, through our world leading research, with our ambition to become the greenest University in the world, and by working to make society more resilient to the effects of the changes we are already experiencing.”
People can find a custom-made graphic for their own country or US state from the website showyourstripes.info, created by Reading’s Institute for Environmental Analytics. The graphics illustrate with colour-coded vertical stripes how temperatures have changed each year over more than a century.
Anyone can download and share the graphics on social media, with others choosing to wear it as a badge, tie or even a cloth face covering. Items are available at: https://www.zazzle.co.uk/store/climate_visuals
Picture credit: University of Reading meteorology graduate, and Good Morning Britain meteorologist Laura Tobin, shows her stripes to viewers of ITV. From @Lauratobin1’ (available at: https://twitter.com/Lauratobin1/status/1175024818590310401/photo/2)
