#madeatreading: Show your stripes for climate science
Thursday, 20 June 2019

Colleagues can see how much average temperatures have risen where they live as part of an international campaign to highlight the importance of climate science.
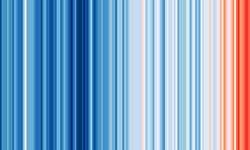
The University’s Institute for Environmental Analytics is inviting people to enter their postcode at showyourstripes.info to generate a climate graphic created by Professor Ed Hawkins in the University’s Department of Meteorology. It illustrates how temperatures have risen since the mid-19th century in their country or US state.
Climate change campaigners, weather presenters and scientists are being invited to share the graphic on Stripes Day on 21 June to raise awareness of the dangers posed by global warming. They can download and share it on social media, and even wear it in the form of a tie, leggings, badge or other items available at https://www.zazzle.co.uk/store/climate_visuals
The day is the culmination of a week-long #madeatreading celebration of world class environmental research at the University as part of Universities UK’s #madeatuni campaign.
Professor Hawkins, from Meteorolgy, said: “We’re asking everyone to show their stripes and raise awareness of the damaging impacts of climate change and support climate scientists worldwide who are helping to fight it.
“It is vitally important that the world wakes up to the dangers of allowing global temperatures to rise unchecked. We have already seen global warming presenting risks to health and society as we know it, and this is only going to get worse unless we take action now.
“We hope that letting people see how temperatures have risen where they live and share this with others will bring home how climate change is an issue for us all, no matter where in the world we are.”
Professor Hawkins first shared his climate stripes graphic online in 2017. It uses a coloured stripe to represent the global average temperature for each year since 1850 – blue for cooler temperatures and red for hotter years.
The thick band of red stripes on the right-hand side acts as a stark warning of how human action has contributed to climate change, making the graphic an effective way of raising public awareness of the issue.
The University has been highlighting its world-leading environmental research that could help save the planet all week, as well as its involvement in sustainability projects in the local community and action it has taken to significantly reduce its own carbon footprint.
Follow the campaign activities on Twitter, Facebook and Instagram, and join the discussion using the hashtag #madeatreading
